
If you work with free email campaigns, you may have read about the importance of studying the metrics of your newsletters.
But …
What the results mean?
How to interpret them and what steps should you take to improve them.
Would you like to know the answers to these questions?
Then read on.
Let’s take the example of our last four campaigns, to understand the process of analysis, and how to work with free email campaigns.
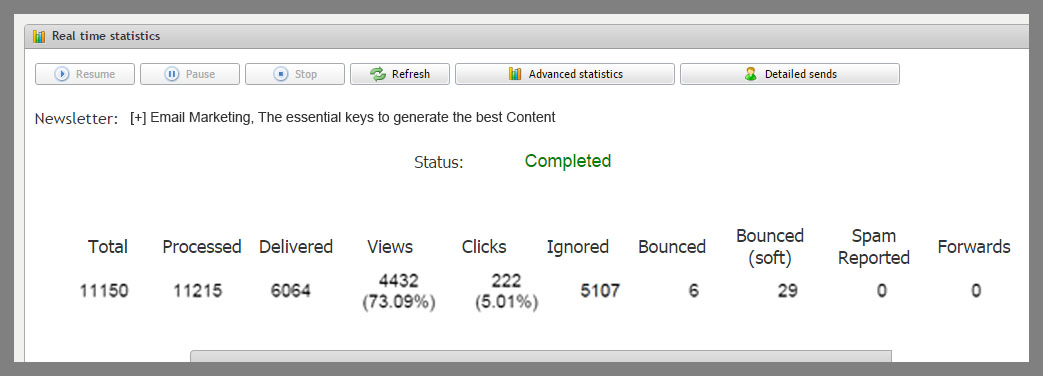
1) [+] Email Marketing, The essential keys to generate the best Content
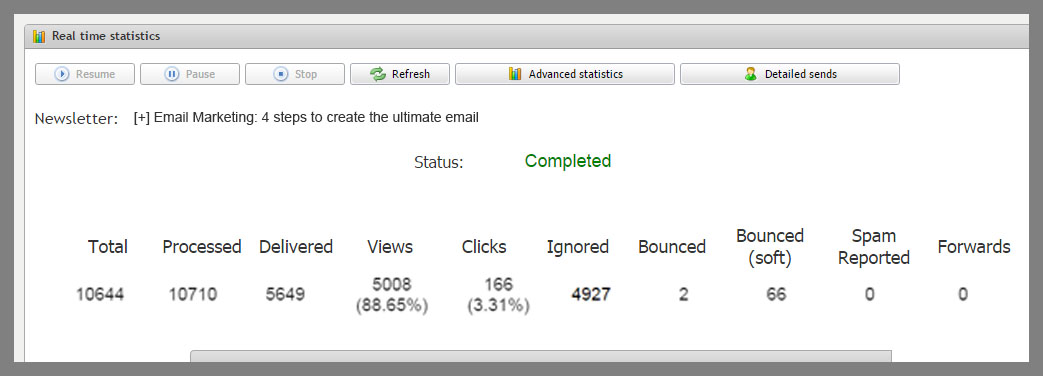
2) [+] Email Marketing: 4 steps to create the ultimate email
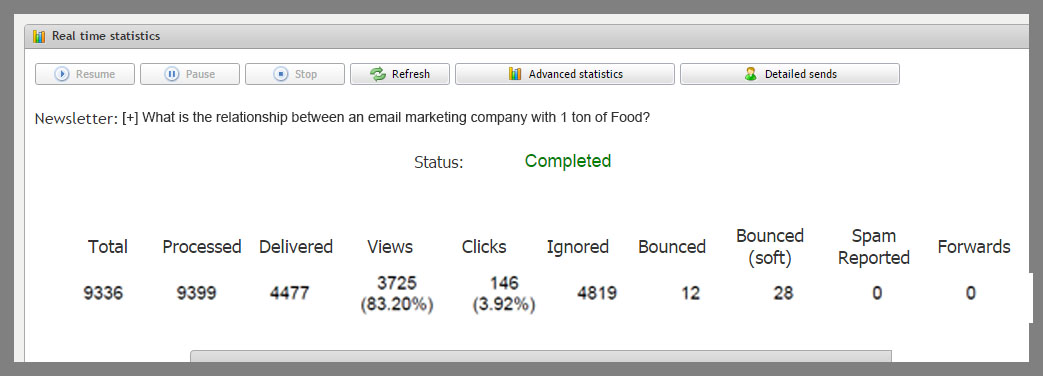
3) [+] What is the relationship between an email marketing company with 1 ton of Food?
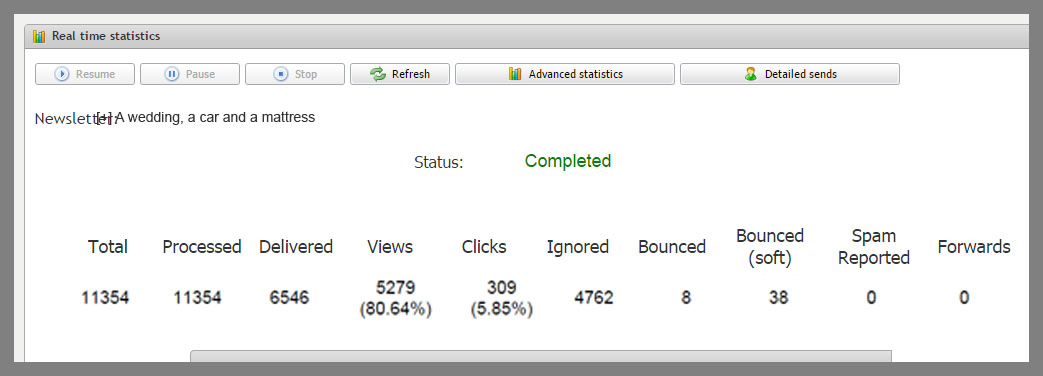
4) [+] A wedding, a car and a mattress
Well, with that, we have four newsletters, each campaign was sent in a different month, therefore it is possible to see an evolution.
The latter is the newest, so it may be that some users still will open the email. In some cases, there are users who open the message a week after the newsletter has been sent. However, the important thing, in my opinion, is to wait for a period of time between each newsletter, to see the changes.
The first campaign is the latest. And the fourth is the oldest. Let’s start telling the story of these free email campaigns.
Free email campaigns statistics step by step
These screens have a lot of information, let’s see:
1) Total of emails:
Newsletter 1 (+ recent): 11,150 emails
Newsletter 2: 10644
Newsletter 3: 9336
Newsletter 4: 11,354
Here we can see the evolution of the number of subscribers of this group of subscribers, which is the group that receives all posts published on the blog.
After sending the Newsletter 4, I moved subscribers from this group of users who receive all newsletters, to another group that only receives a weekly newsletter.
After this change, the number of contacts was reduced to 9336, and then it increased again to 11,150 subscribers.
Here we have a first indication of the evolution of the mailing list. It is growing, which is a good sign, it will get more subscribers with time.
This is the ideal situation.
If the list was static, we would start to have problems, there would be less potential new customers, reducing our business opportunities.
TIP: It is important to use a strategy when working with free email campaigns, to attract new subscribers and increase your mailing list.
2) Delivered:
– Newsletter 1 (+ recent): 6,064 emails
Newsletter 2: 5649
Newsletter 3: 4477
Newsletter 4: 6546
Here we also see a reduction in the number of subscribers after the newsletter 4 and then we can see how the list was growing.
What is the difference between the total of emails and the number of delivered messages?
The total of emails will include wrong emails, bounced, etc. That at some time were added to the list.
When the number of total emails increases a lot, but the number of delivered messages does not, it is a sign that you are adding low quality emails in your database.
For example, if you import a new database, and it has many invalid emails, the total number will increase, but not the number of delivered messages, and this is a sign that you added a list of low quality.
We can see that between the newsletters 3 and 2 1,308 new contacts were registered, and this time we had 1,172 new emails delivered. Between the newsletter 2 and 1 there were 506 new contacts and 415 have been delivered.
As you can see, these are very similar values, if there was a big difference, we would need to review the mailing because it would probably be low quality.
TIP: Make sure to use quality lists, double opt-in, and try sending frequent campaigns to clean your mailing from invalid emails.
3) Views:
– Newsletter 1 (+ recent): 73.09%
Newsletter 2: 88.65%
Newsletter 3: 83.20%
Newsletter 4: 80.64%
Views, are also a sign that will show us that the mailing list is growing,
We moved inactive subscriber from this group after the newsletter 4. The rate reached 83.20% then decreased to 88.65% and 73.09%.
If it continues and the rate is low after several free email campaigns, with different subjects, maybe it’s time to segment subscribers again and update the mailing list.
Normally, in my case, I have noticed that those who do not open newsletters during weekdays for a while, usually open emails on weekends. And with a lower volume of messages.
And that’s exactly what I do, moving these users to other groups, segmenting the mailing list by frequency.
This is an option that we also offer, but sometimes users don’t use, so we do a manual segmentation.
TIP: When creating free email campaigns, it is not always easy to segment your list, but as far as possible, it is important to keep segmenting your databases according to your subscribers preferences, and optimize the process day by day.
4) clicks:
– Newsletter 1 (+ recent): 222 (5.01%)
Newsletter 2: 166 (3.31%)
Newsletter 3: 146 (3.92%)
Newsletter 4: 309 (5.85%)
We send all the content of the post in the newsletter, so the click rate is low. When we only sent a small text, the click rate used to be twice what it is now.
You can also see a pattern in the evolution of clicks, the variation in them can give us much information about the preferences of our subscribers and the effectiveness of our calls to action.
A higher click volume means greater interest of your subscribers.
We have to take into account the number of subscribers, as campaigns with greater number of subscribers will have more potential volume of clicks.
TIP: Try to improve your calls to action, with visible links, buttons, etc. Varying over time, and always paying attention to any variation.
5) Bounces and soft bounces
– Newsletter 1 (+ recent): 6 bounces 29 soft
Newsletter 2: 2 bounces 66 soft
Newsletter 3: 12 bounces 28 soft
Newsletter 4: 8 bounces 38 soft
In almost all campaigns you will have bounced emails, especially As time goes by and your list is growing. However, if the volume is small, it is perfectly acceptable and natural.
Emails soft bounces are those who, for a temporary reason did not receive the newsletter this time, but may receive your future campaigns.
Bounced emails, or hard bounces are incorrect accounts or domains which no longer exist, and therefore you cannot send emails for these accounts.
TIP: Always try to use lists generated with double opt-in to ensure that the emails are valid, at least. Send periodic free email campaigns To avoid the accumulation of many bounced emails. If you are working on creating your first email marketing campaign, you can try to break your mailing list down into smaller segments.
If an ISP verify that your campaign includes many bounces, it will penalize your domain and it will affect the rest of the newsletter, and possibly future campaigns as well.
6) Reported as spam
– Newsletter 1 (+ recent): 0
Newsletter 2: 0
Newsletter 3: 0
Newsletter 4: 0
As in the previous case, a list with many subscribers will have a higher probability of receiving some spam complaints from time to time. Let us be honest, if you have thousands of subscribers, it is normal that some users will decide to mark your campaign as spam at some point. Maybe because they don’t like a particular campaign, or because they didn’t bother to unsubscribe correctly.
In addition, most subscribers don’t know the ins and outs of email marketing, many of them don’t know that when they flag your free email campaigns as spam they are hindering your company, what they know is that by clicking to mark the email as spam they will no longer receive emails from you, which is what they want.
The spam rate accepted for an opt-in list is 0.02%
TIP: The most important is to work on all aspects when working with free email campaigns, using only opt-in lists, or adding subscribers who actually requested to receive your newsletters.
It is also very important that your contacts can unsubscribe comfortably.
These are the real-time metrics of an email marketing campaign
We could also analyze various information available in advanced statistics, for example:
1) Unique Views vs total views to see how often, on average, subscribers open your newsletters
2) Clickers, we can see which subscribers clicked on the links of your campaigns.
3) Views, this information allows you to distinguish between unique views and all the users who viewed your newsletters.
4) links, to see which links received more clicks, this is very important as this information will help you improve your calls to action.
5) Etc.
But looking at these metrics you can already have sufficient information in order to improve the creation of email marketing and understand how your campaign is evolving.